Running Costs
What a Supercar Really Drinks, Against the Official Figure
One published comparison puts a V10 at 13.7 litres per 100 km on the official test and about 22 in real use. The tank does not change, so the range falls by a third.
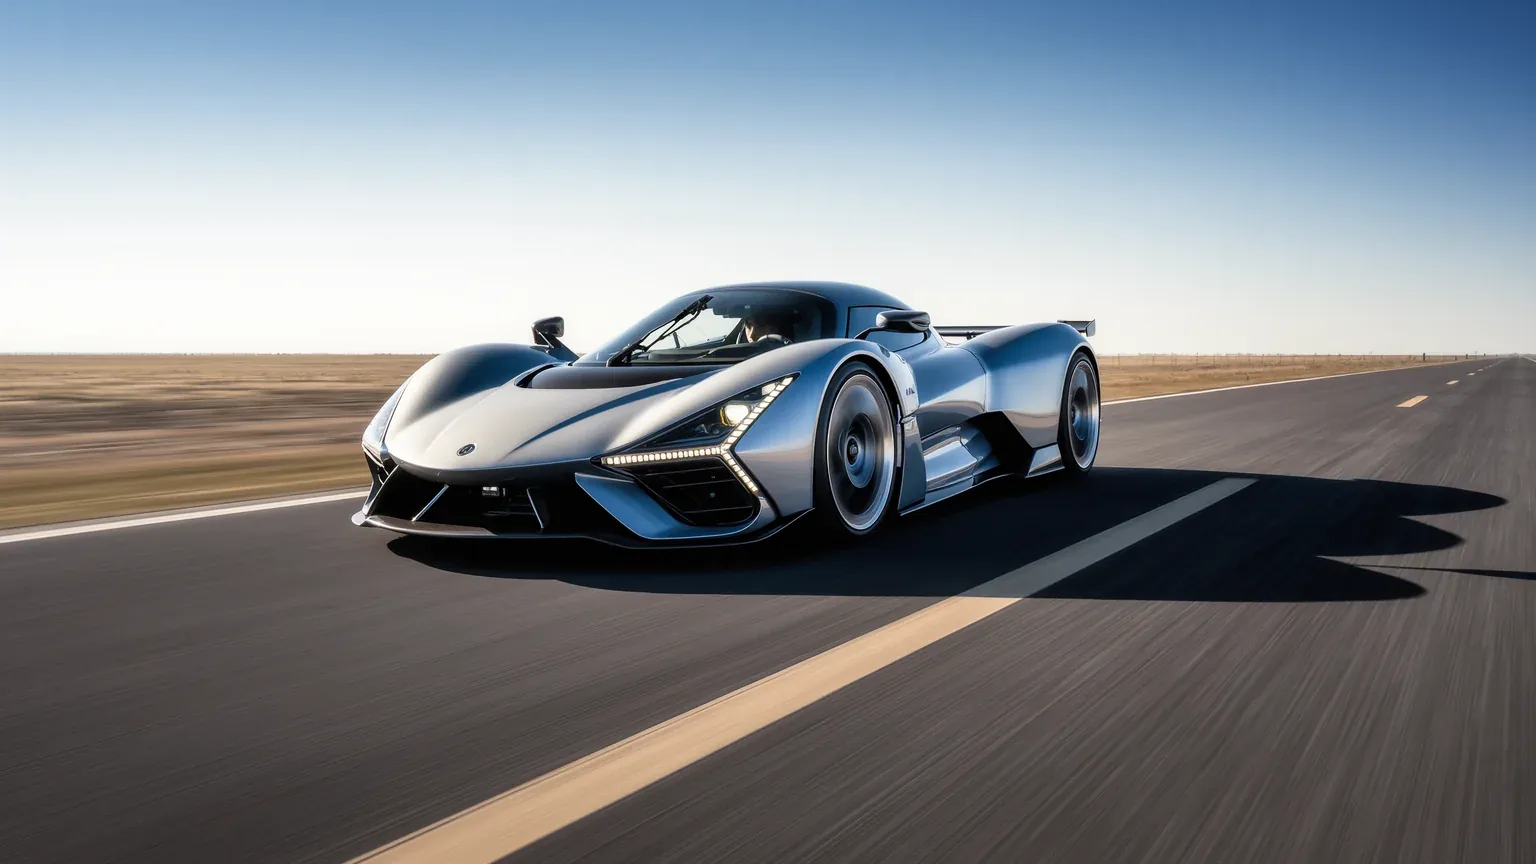
The official figure and the one an owner sees are far enough apart that they describe different cars. Published data for a 5.2 litre V10 gives an official combined consumption of 13.7 litres per 100 km and an estimated real world figure of about 22. The tank stays at 83 litres either way, so the honest range is a third shorter than the brochure implies.
The gap, in both directions
| Measure | Official | Estimated real world | Difference |
|---|---|---|---|
| Litres per 100 km | 13.7 | 22.0 | 8.3 more |
| Miles per gallon, UK | 21 | 13 | 8 fewer |
| Miles per gallon, US | 17 | 11 | 6 fewer |
| Range on 83 litres | 606 km | 377 km | 229 km less |
Going from 13.7 to 22 litres per 100 km is 60.6 per cent more fuel. The source itself describes the real world figure as running about 63 per cent above the factory number, which is the same statement made from unrounded inputs. Either way the direction and the scale are not in doubt.
One published figure on the same page is mislabelled and worth flagging rather than repeating: CO2 is given as 332.0 grams per 100 km. Emissions of that kind are measured per kilometre, and 332 g/km is a plausible figure for this engine while 332 per 100 km is not. The number is usable, the unit on it is not.
Why the gap is larger on this class of car
Three reasons, and only the first applies to ordinary cars.
- The test cycle is gentle by design. Official procedures use prescribed accelerations that no owner of a car with this output reproduces, and the gap between test and use widens with the size of the gap between available power and power used.
- Cold running is a larger share of the journey. These cars are used for short trips more often than long ones, and consumption before an engine reaches temperature is far worse than the average implies.
- The consumption swing is enormous. Between a steady motorway cruise and enthusiastic use, the same car can double its consumption, so a single average figure hides most of what the owner experiences.
What that costs a year
Fuel is one of the few costs that scales with use rather than with time, which makes it the opposite of nearly everything else on this site. At 22 litres per 100 km:
| Distance per year | Litres | Cost | Per mile |
|---|---|---|---|
| 2,000 miles, 3,219 km | 708 | 1,275 | 0.64 |
| 5,000 miles, 8,047 km | 1,770 | 3,187 | 0.64 |
| 10,000 miles, 16,093 km | 3,541 | 6,373 | 0.64 |
The per mile figure does not move, which is the entire point of it. Fuel costs 0.64 per mile whether the car covers 2,000 or 10,000, while insurance, servicing and depreciation are billed by the year and get cheaper per mile the more the car is used. The price assumption of 1.80 a litre is stated rather than sourced, and it scales proportionally: at 2.00 a litre the per mile figure is 0.71.
Where it sits against everything else
Fuel feels like the running cost because it is the one paid in person. It is rarely the largest. On a car covering 2,000 miles a year, fuel at 1,275 sits below an insurance premium at the specialist benchmark of 1 to 1.5 per cent of a 200,000 value, which is 2,000 to 3,000, and far below a single scheduled service year with a major tier in it.
It is also the only one of those an owner reduces by using the car less, and using the car less makes every other line worse per mile. That trade is the reason this site measures costs per year and per mile side by side rather than choosing one.
Questions readers ask
What is the real world fuel consumption of a supercar?
On published data for a 5.2 litre V10, an official combined figure of 13.7 litres per 100 km against an estimated real world figure of about 22, which is 60.6 per cent more fuel. In UK miles per gallon that is 21 official against 13 real.
How far will a tank actually take me?
On an 83 litre tank, about 606 km at the official figure and about 377 km at the real world one, a difference of 229 km. Planning on the brochure range is how a car ends up on a low fuel warning a third earlier than expected.
Why is the official figure so far out?
The test cycle uses prescribed gentle accelerations, these cars do a high proportion of short cold journeys, and consumption between cruising and enthusiastic use can differ by a factor of two. All three widen the gap on a high output car.
What does fuel cost per year?
At 22 litres per 100 km and 1.80 a litre, about 1,275 for 2,000 miles, 3,187 for 5,000 and 6,373 for 10,000. That works out at 0.64 per mile at any distance, because fuel is the one cost that scales with use rather than with time.
Is fuel the biggest running cost?
Rarely. On a car covering 2,000 miles a year, fuel at about 1,275 sits below an insurance premium of 2,000 to 3,000 at the 1 to 1.5 per cent benchmark on a 200,000 car, and well below a major service year.
Are the CO2 figures reliable?
The figure is, the unit on it sometimes is not. One published source gives 332.0 grams per 100 km, where emissions of that kind are measured per kilometre. As 332 g/km it is plausible for the engine, as printed it is not.
Sources
- MotorEU, Huracán fuel consumption and technical specifications, for the 13.7 litres per 100 km official combined figure, the estimated real world figure of about 22, the UK and US mpg equivalents, the 83 litre tank and the CO2 value.
- evo, Huracán MPG and running costs, for the comparison against rivals, including the Porsche 911 Turbo S at up to 31 mpg and the McLaren 570S at 26.6 mpg.