Depreciation
Which Supercars Hold Value, and What They Have in Common
The cars that resist depreciation share supply characteristics, not engineering ones. What the Hagerty and iSeeCars data actually show, and what a buyer can read before signing.
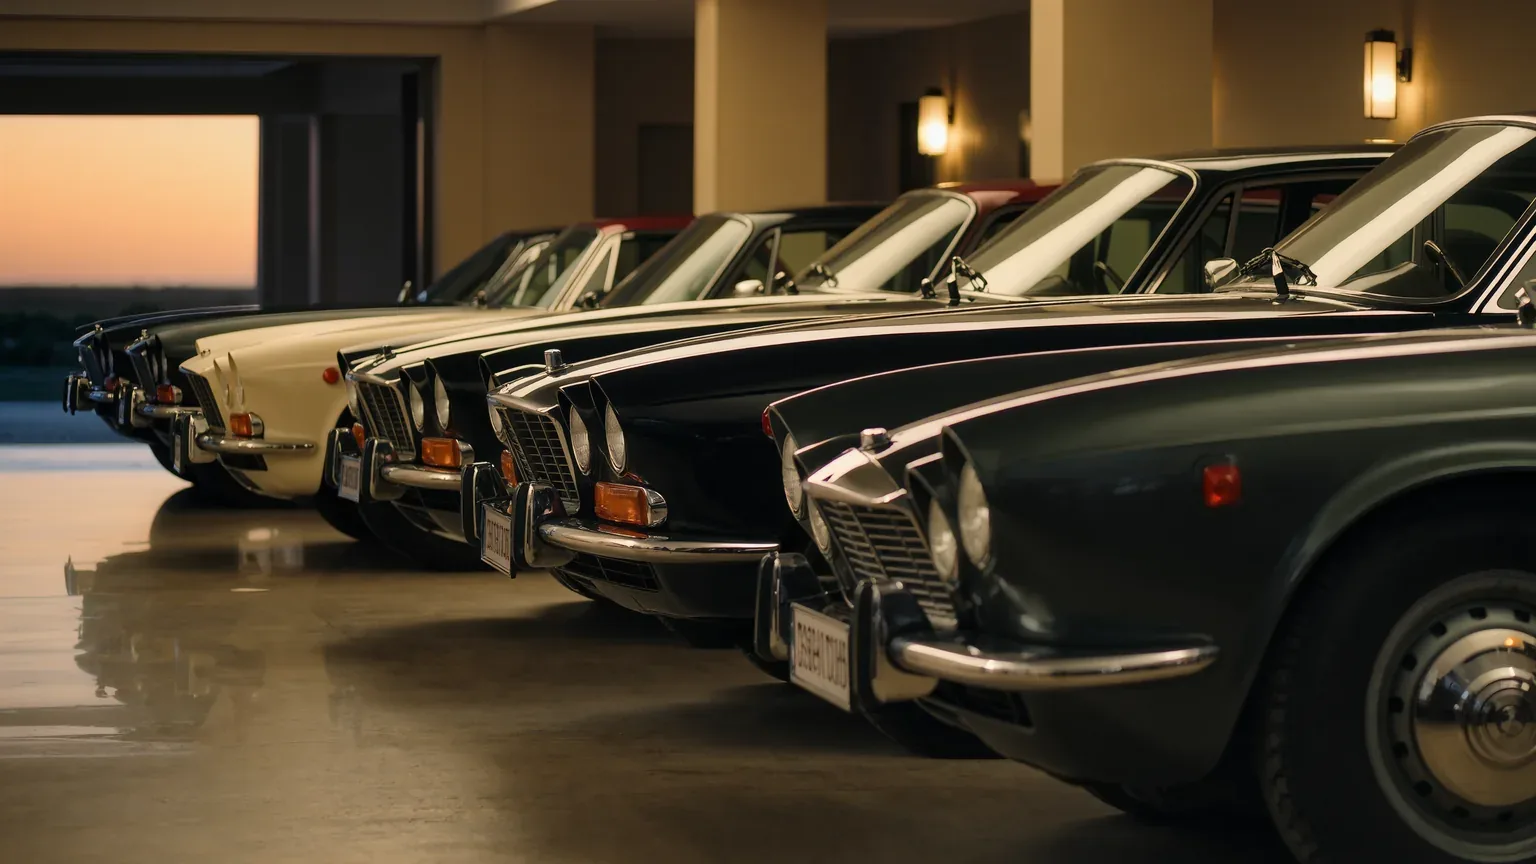
Ask which supercars hold their value and the answers come back as a list of models. The list is the wrong output. In the Hagerty data the cars that resisted depreciation over three years share almost nothing mechanically, and the cars that fell hardest include some of the most capable machines ever put on sale. What the winners share is on the order book, not under the engine cover.
What the two studies measured
The supercar figures come from a Hagerty analysis of modern supercars built on more than 24,000 insurance policy quotes gathered over four years, cross referenced against listing and finance data and tracked model year by model year. Its headline is an average loss of about 6 per cent after one year and 20 per cent after three.
The mainstream reference point comes from iSeeCars, which analysed more than 950,000 five year old cars sold between March 2025 and February 2026 and put the average five year loss at 41.8 per cent. In that data set the single best performing model was not a supercar at all. It was the Porsche 718 Cayman at 9.6 per cent over five years, against 63.1 per cent for the worst placed car and 57.2 per cent for electric vehicles as a class.
Two different horizons, two different countries, two different populations. Neither can be subtracted from the other, and both point the same way on the question this article asks.
The spread inside the average
| Car or group | Horizon | Loss | Source |
|---|---|---|---|
| Ferrari 488 Pista Coupe | 1 year | +6 % | Hagerty |
| Ferrari 488 Pista Coupe | 3 years | about 7 % | Hagerty |
| Porsche 718 Cayman | 5 years | 9.6 % | iSeeCars |
| Modern supercar average | 3 years | 20 % | Hagerty |
| McLaren and Aston Martin | 3 years | 20 to 25 % | Hagerty |
| Porsche 911 GT2 RS | 3 years | about 30 % | Hagerty |
| All cars | 5 years | 41.8 % | iSeeCars |
| Electric vehicles | 5 years | 57.2 % | iSeeCars |
The 911 GT2 RS is the point worth sitting with. It is a homologation grade car with a factory Nürburgring record to its name, and it sits near the bottom of the three year table at about 30 per cent while a Ferrari with less power sits at the top. Capability did not decide the outcome.
What the value holders share
Four characteristics recur across the cars at the strong end of both data sets, and all four are supply side.
- A production run short enough that demand outruns it. The 488 Pista appreciated in year one because more people wanted one than were built. That is arithmetic, not enthusiasm.
- No announced direct replacement. A model with a successor already dated has a ceiling on it. The market prices the replacement before it arrives.
- A brand with a controlled order book. Hagerty found the Italian cars losing less over three years than the German ones, and the Lamborghini Huracán holding better than the Audi R8 5.2 V10 despite the two sharing their fundamental mechanical package. One engine family, two curves, and the difference is allocation policy.
- A price that never carried an inflated premium. A car bought at 20 per cent over list starts 20 points down before the first mile, because the premium unwinds first and the depreciation runs on top of it.
The percentage means nothing without its base
Every figure above is quoted against list price. That is the convention and it flatters the result. On this class of car options routinely add 15 to 25 per cent to the transaction price and are largely absent from residual percentages.
Take a car at 250,000 list with 50,000 of options, so 300,000 paid. Sell it at 80 per cent of list, which is 200,000, and the honest answer to how much it lost is either 20 per cent or 33.3 per cent depending on which number you started from. The gap is 13.3 percentage points and 100,000 in money against the 50,000 the list based figure implies. Both answers are true. Only one of them is what left the bank account.
What a buyer can check before signing
None of the four characteristics require a valuation service to read. Production volume is published or knowable. A replacement model is usually signalled a year ahead. The premium over list is visible in the deal itself. What cannot be read in advance is which of this year's cars will be next year's short supply, which is why the honest version of this article stops at the pattern and does not extend it into a forecast.
The single most reliable finding across both studies is negative rather than positive: a car bought above list, in a series with ample supply, with a successor already announced, has all three of the known risk factors at once. That combination is visible on the day of purchase, and it is the only part of depreciation a buyer controls.
Questions readers ask
Which supercar holds its value best?
In the Hagerty three year data the Ferrari 488 Pista Coupe leads, appreciating about 6 per cent in year one and sitting only around 7 per cent down at three years. In the wider iSeeCars five year data the best placed performance car is the Porsche 718 Cayman at 9.6 per cent, against a 41.8 per cent all car average.
Do Ferraris depreciate less than other supercars?
On the Hagerty numbers the Italian cars lose less over three years than the German and British ones as a general pattern. The study reads that as a supply and allocation effect rather than a quality one, which is supported by the Lamborghini Huracán holding better than the mechanically related Audi R8 5.2 V10.
Why did the 911 GT2 RS fall so far?
It launched with a strong premium over list and a high list price, and both unwound. Hagerty records about 12 per cent down in year one and about 30 per cent by year three. A premium paid over list is normally the first value to disappear, and the ordinary depreciation then runs on top of it.
Does low production volume guarantee a strong residual?
No. Short supply is necessary and not sufficient. It has to be short against actual demand, which is why some limited runs trade above list for years and others settle back to list within months of the last delivery.
Are these percentages against list price or against what I pay?
Against list, which is the friendlier of the two bases. On a car with 50,000 of options on a 250,000 list price, a resale at 80 per cent of list is 66.7 per cent of what the first owner actually handed over, a gap of 13.3 percentage points.
Can I use the 41.8 per cent figure to compare against the 20 per cent?
Only with both horizons named. The 41.8 per cent is five years of US transaction data across more than 950,000 cars. The 20 per cent is three years of UK insurance and listing data. They agree on direction and they are not arithmetically comparable.
Sources
- Hagerty UK, comparing the depreciation of modern supercars, published 19 May 2021, for the 6 and 20 per cent averages, the per model results and the 24,000 policy quote method.
- iSeeCars, cars that hold their value, for the 41.8 per cent five year average, the 950,000 car sample, the 9.6 per cent Porsche 718 Cayman result and the segment figures.