Depreciation
New or Three Years Old: The Five Year Cost Compared
A three year old supercar has already had 20 per cent taken out of it by someone else. Whether that makes it cheaper to own depends on which costs move with age and which do not.
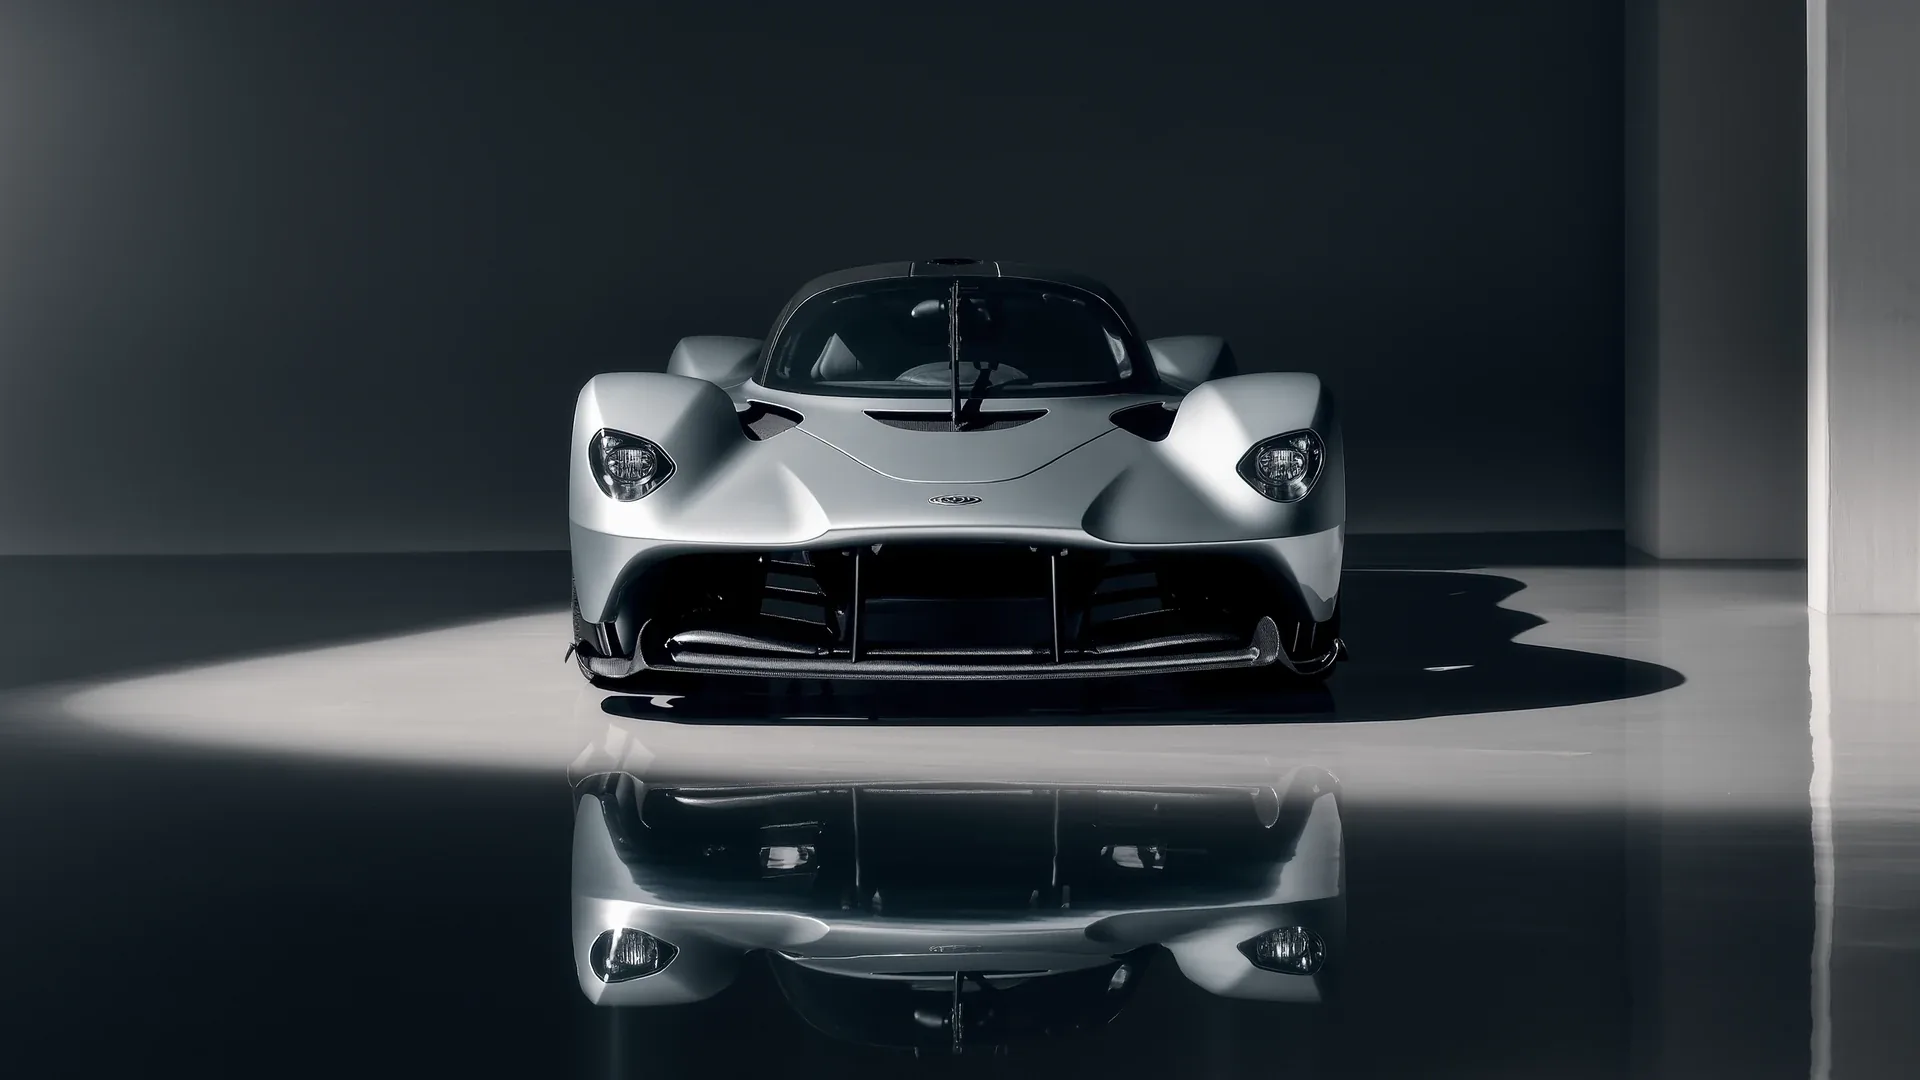
The case for buying used is that the first owner absorbed the 20 per cent the Hagerty data records over three years. The case against is that four costs move the other way, and two of them are large. Set out over the same five years, on the same car, the gap is smaller than the depreciation figure implies and it does not always fall on the side people expect.
What the data actually establishes
Two figures anchor this comparison and neither runs the full length of it. The Hagerty study, published 19 May 2021, covers three years and finds about 6 per cent gone at year one and 20 per cent by year three. The iSeeCars study covers five years across more than 950,000 cars and finds 41.8 per cent for the market as a whole, a population that is not supercars.
There is no published five year supercar curve. Anything past year three in the table below is the shape of the curve applied forward, and it is labelled as such rather than presented as measurement.
The same car, two entry points, five years each
Take a model at 250,000 list. Buyer A takes it new. Buyer B takes the same car at three years old, which on the measured average means paying about 200,000. Both keep it five years.
| Line | Buyer A, new | Buyer B, three years old |
|---|---|---|
| Paid | 250,000 | 200,000 |
| Car age at sale | 5 years | 8 years |
| Assumed value at sale | 162,500 | 143,750 |
| Depreciation borne | 87,500 | 56,250 |
| Per year | 17,500 | 11,250 |
| Share of purchase price | 35.0 % | 28.1 % |
Buyer B carries 31,250 less depreciation across the same five years, which is 6,250 a year. That is the entire advantage, and it is the number the used case is usually argued on.
The four costs that run the other way
Against that 6,250 a year sit costs that arrive with age rather than with ownership.
- Warranty. Buyer B's car is out of its original cover, or close to it. An extended contract has a price and a set of exclusions, and a single major failure outside it can be a five figure event on this class of car.
- Deferred maintenance. A three year old car is approaching the first genuinely expensive scheduled items. Buyer A paid for the cheap early services and hands over a car about to need the expensive ones.
- Consumables at the wrong point in their life. Tyres and brake fluid age on the calendar. A three year old car with original tyres is a car with a replacement set due, whatever the tread depth says.
- Condition risk. Buyer A knows the whole history because they wrote it. Buyer B is buying a document trail, and any gap in it is priced by the next buyer as well.
If those four together average 7,000 a year more on the older car, and on a supercar that is not a stretch, the depreciation advantage of 6,250 is gone. If they average 4,000, the used car is ahead by 2,250 a year. The comparison is genuinely close, which is why it is argued about so much and settled so rarely.
What actually decides it
Three things move this comparison further than the age of the car does.
Which model. The 20 per cent average conceals a range from a car that gained 6 per cent in year one to one that lost about 30 per cent by year three. Buying the first model used saves very little because very little was lost. Buying the second used transfers a much larger loss to the first owner.
What was paid at the start. A new car bought at a premium over list is the worst position in this table, because the premium disappears first and is not part of any published percentage. A new car bought at list on a model with genuine scarcity is the best.
How long it is kept. The curve is steepest early, so the longer either buyer holds, the smaller the annual difference between them. Across a two year hold the entry point dominates. Across a ten year hold it barely registers.
Where this argument is weakest
The five year figures above are an extension of a three year study, and the extension is the part doing the work. If the real curve flattens faster than assumed, Buyer B does better than the table shows, because more of Buyer B's ownership sits on the flat part. If a model has a successor announced during the period, both buyers do worse and the older car does worse still.
The one part that is not assumption: the first owner of a series production supercar carries the largest single annual loss the car will ever produce, and no arrangement of servicing, tyres or insurance on the used side comes close to the size of it.
Questions readers ask
Is it cheaper to buy a used supercar than a new one?
On depreciation alone, yes. Using the measured 20 per cent three year average on a 250,000 car, a used buyer carries about 31,250 less over five years, roughly 6,250 a year. Warranty, deferred maintenance, age dated consumables and condition risk eat into that and can remove it entirely.
How much has a three year old supercar already lost?
About 20 per cent on the modern supercar average from the Hagerty study published 19 May 2021, with roughly 6 per cent of that gone in the first year. Individual models range from a gain of 6 per cent in year one to about 30 per cent down at three years.
What is the biggest hidden cost of buying used?
The warranty position, followed by the service schedule. A three year old car is out of or near the end of original cover at the same time as it approaches the first expensive scheduled items, so two costs land together.
Does the model matter more than the age?
Usually. Buying used saves the most on a car that lost the most, and almost nothing on a car that held its value. On a model that gained value in year one there is no first owner loss to inherit.
Are the five year figures measured?
No. The published supercar study covers three years. The five year lines here extend its curve and are presented as an extension. The 41.8 per cent five year figure from iSeeCars is measured but covers ordinary cars rather than supercars.
What is the worst position to be in?
Buying new at a premium over list on a series production model with a successor already announced. The premium is not in any published residual percentage, it disappears first, and ordinary depreciation then runs on top of it.
Sources
- Hagerty UK, modern supercar depreciation, published 19 May 2021, for the three year curve, the 6 and 20 per cent averages and the per model spread.
- iSeeCars, cars that hold their value, for the 41.8 per cent five year market average across more than 950,000 cars, used here only as the boundary of what is measured.