Depreciation
What a Supercar Loses in Its First Three Years
Modern supercars lose about 6 per cent in year one and 20 per cent by year three, against 41.8 per cent over five years for the average car. The averages hide everything.
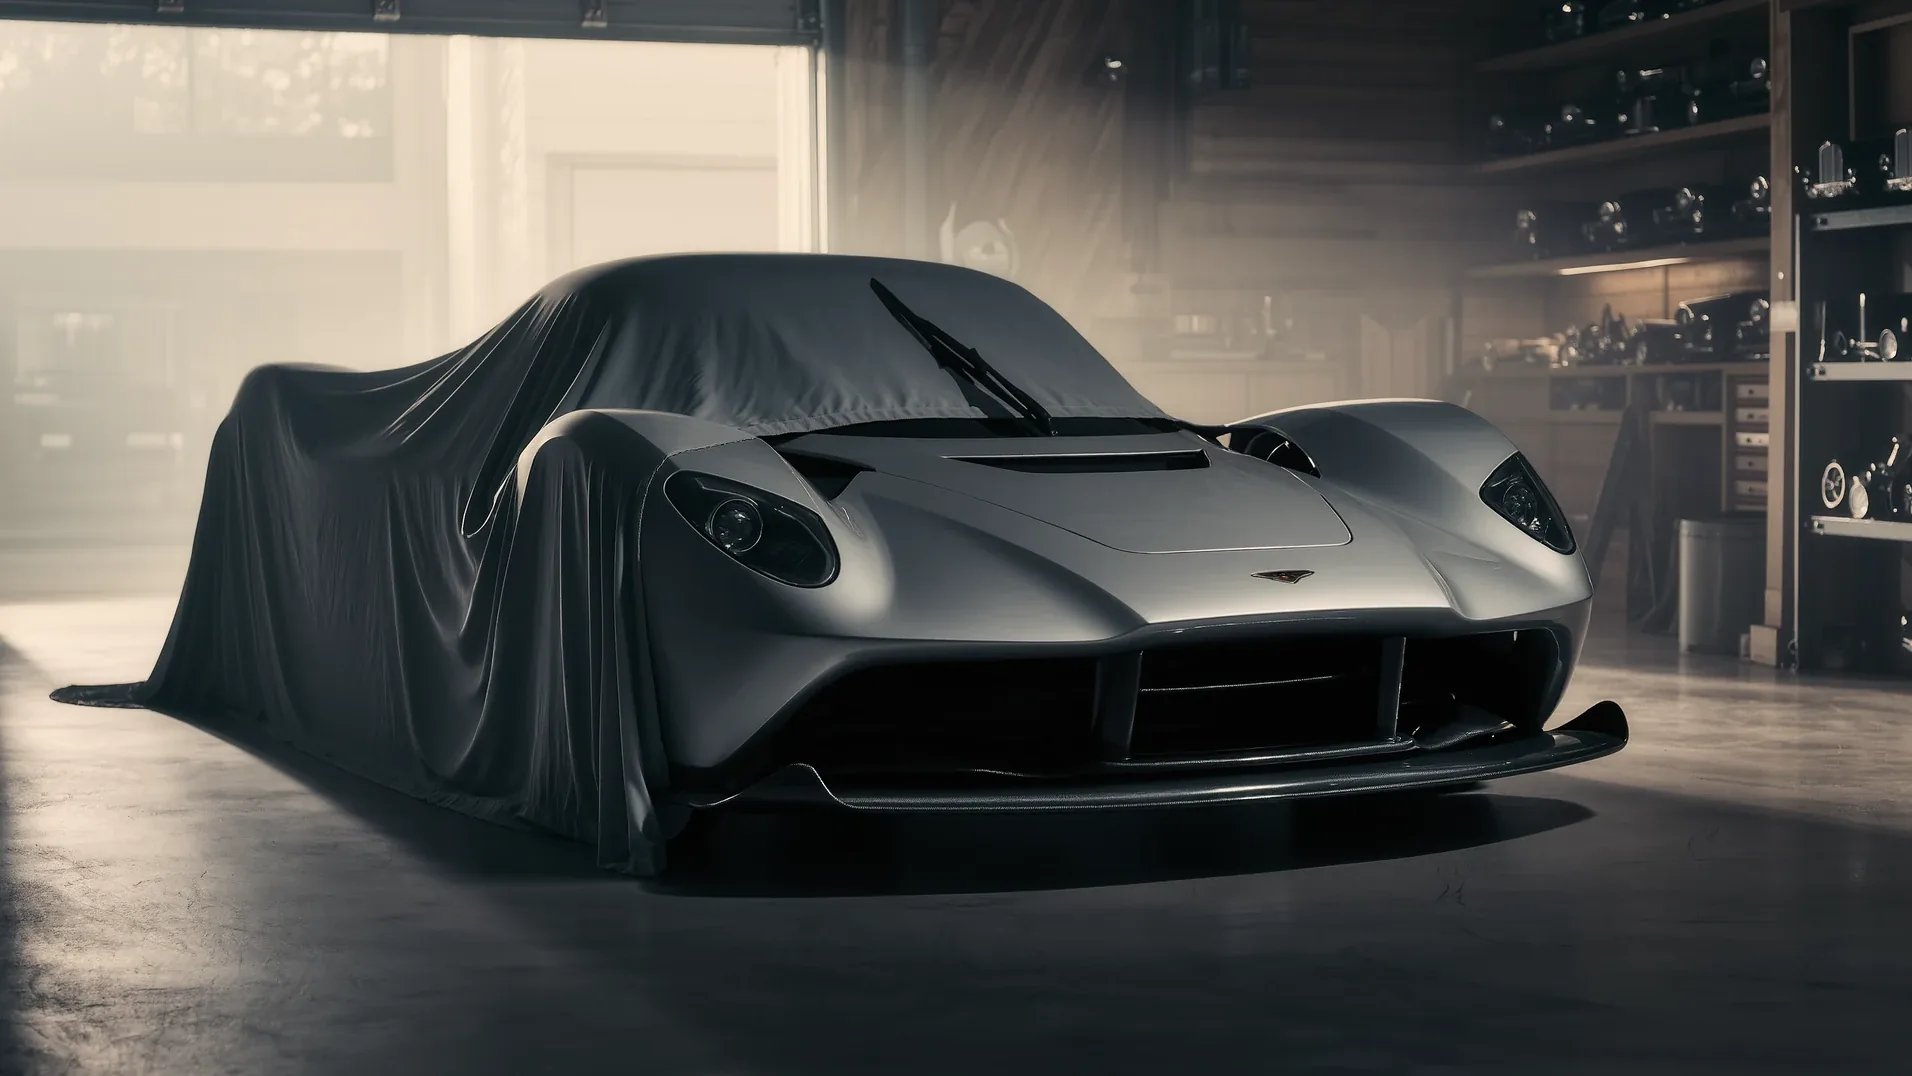
A Hagerty study of modern supercars puts the loss at roughly 6 per cent after one year and 20 per cent after three. Against the average car, which iSeeCars measured at 41.8 per cent over five years, that looks like a class of car that holds money unusually well. Both figures are sound, they are not measuring the same thing, and inside the supercar average sits a spread from a car that gained value in year one to one that lost nearly a third by year three.
The measured figures, and where they come from
The supercar figures come from a Hagerty analysis built on more than 24,000 insurance policy quotes gathered across four years, combined with listing and finance data, tracked model year by model year. That method matters. It measures cars that owners were insuring and listing, which is a different population from cars that were sold new and never moved.
The mainstream comparison comes from a different place entirely. iSeeCars analysed over 950,000 five year old used cars sold between March 2025 and February 2026, and reported an average five year loss of 41.8 per cent, up 3.8 percentage points on the previous edition. By segment, trucks lost 34.2 per cent, hybrids 35.4 per cent and electric vehicles 57.2 per cent.
Putting 20 per cent next to 41.8 per cent and concluding that supercars halve the loss is the mistake this article exists to prevent. One is three years, the other is five. One is UK insurance and listing data, the other is US transaction data. They agree on direction and they cannot be subtracted from each other.
The average is the least useful number in the study
Inside that 20 per cent sit results that have almost nothing to do with one another.
| Model | Year one | By year three | What drove it |
|---|---|---|---|
| Ferrari 488 Pista Coupe | +6 % | about -7 % | Limited run, demand above supply |
| Modern supercar average | -6 % | -20 % | Reference line |
| McLaren and Aston Martin | -20 to -25 % | Series production, ample supply | |
| Porsche 911 GT2 RS | -12 % | about -30 % | High list, strong initial premium unwinding |
The distance between the best and the worst line is 18 percentage points at year one, from plus 6 to minus 12, and 23 points by year three, from minus 7 to minus 30. On a car listing at 300,000 units of currency that is a difference of about 69,000 over three years, decided before the first service is due.
The 488 Pista line is the one that deserves attention, because a car that appreciates in its first year and is still only about 7 per cent down at three has inverted the normal shape. That is a supply outcome, not a quality outcome. Nothing about the engineering causes it.
A pattern that holds across marques
The study finds the Italians losing less over three years than the Germans, and it finds the Lamborghini Huracán holding better than the Audi R8 5.2 V10 despite the two sharing their fundamental mechanical package. Two cars, one engine family, materially different curves.
Whatever is driving that is not measurable at the workshop. It is brand scarcity, production volume, and how many of each were built with the expectation of being driven. That is worth stating plainly because it points at the only lever a buyer actually controls: what was built, in what quantity, and whether the model has a direct replacement announced.
The percentage is meaningless without its base
Three different bases are in common use for residual percentages and they are not interchangeable:
- List price before options. The friendliest base, and the one press figures usually use.
- Transaction price including options and delivery. On this class of car options routinely add 15 to 25 per cent, and most of that is not recovered.
- The price actually paid. On an allocated car this can exceed list, and any premium paid over list is normally the first thing to disappear.
Take a car listing at 200,000 with 40,000 of options, so 240,000 paid. If it resells at 160,000, that is 80 per cent of list and 66.7 per cent of what the first owner handed over. The same car, the same sale, a gap of 13.3 percentage points between the two honest answers, worth 80,000 in real money against the 40,000 the list based figure implies.
What follows from this
Three years is the interval at which the curve is steepest and therefore the interval where the choice of model matters most. After that the annual loss falls in every subsequent year on a normally produced car, which is why the second owner of a series production supercar takes a much smaller hit than the first, and why the first owner of a genuinely limited one sometimes takes none at all.
None of this makes depreciation optional. It makes it the one cost on this site that is decided almost entirely at purchase, before a single service, tyre or premium is paid.
Questions readers ask
How much does a supercar lose in three years?
About 20 per cent on average, with roughly 6 per cent of that in the first year, according to a Hagerty study built on more than 24,000 policy quotes. Individual models range from a slight gain in year one to about 30 per cent down by year three.
Is that better than a normal car?
On direction, yes, but the figures are not directly comparable. The 41.8 per cent average from iSeeCars is a five year figure from US transaction data across more than 950,000 cars, while the 20 per cent is a three year figure from UK insurance and listing data. Both are sound and neither can be subtracted from the other.
Can a supercar gain value in its first year?
Yes, when supply is genuinely short. The Ferrari 488 Pista Coupe appreciated about 6 per cent in year one in the Hagerty data and was still only around 7 per cent down at three years. That is a production volume outcome rather than anything about how the car drives.
Why does the Huracán hold better than the Audi R8?
The two share their core mechanical package, so the difference is not engineering. It comes down to production volume, brand scarcity and buyer expectation. The study finds the Italian cars losing less over three years than the German ones as a general pattern.
Do options come back at resale?
Mostly not. Options routinely add 15 to 25 per cent to the transaction price on this class of car and are largely absent from residual percentages, which are usually quoted against list. A car at 80 per cent of list can be at 65 per cent of what was actually paid.
When does the loss slow down?
The curve is steepest in the first three years and the annual loss falls in each year after that on a normally produced car. That is why the second owner of a series production supercar carries a much smaller share of the total depreciation than the first.
Sources
- Hagerty UK, comparing the depreciation of modern supercars, published 19 May 2021, for the 6 per cent and 20 per cent averages, the per model figures and the method behind them.
- iSeeCars, cars that hold their value, for the 41.8 per cent five year average, the sample of over 950,000 cars and the segment breakdown.