Depreciation
When the Depreciation Curve Finally Flattens
The Jaguar XJ220 fell almost 82 per cent and has never recovered its list price. The Ferrari 288 GTO never fell at all. The floor exists, and it sits at wildly different depths.
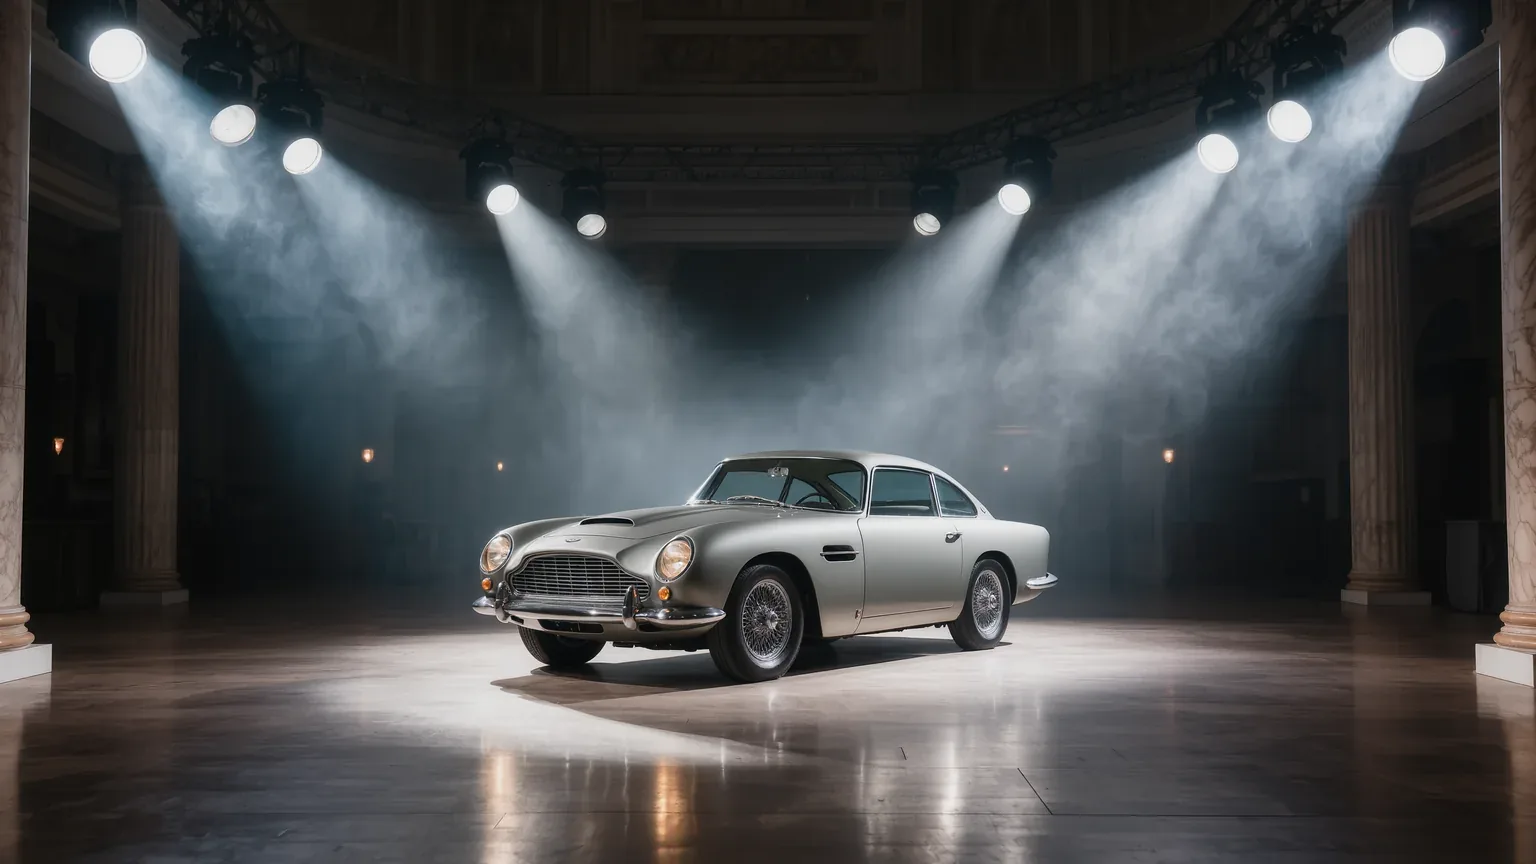
The comforting version says a supercar falls for a few years, flattens, and eventually turns back up. Hagerty tested it against 28 limited production cars and found the shape is real and the timing is not. One car in that set fell almost 82 per cent and has still not recovered its list price after three decades. Another never fell below list at all and is now worth about 32 times what it cost.
What was compared
The analysis, published by Hagerty on 26 January 2018, tracked 28 limited production collector cars from the 1978 to 1981 BMW M1 through to the Bugatti Chiron and Pagani Huayra. Its finding on the older half of that set is blunt: the value of almost every older supercar fell well below its original list price before rebounding.
That sentence contains the whole subject. There is a trough, it is usually deep, and the rebound is a separate question from the fall.
| Car | List when new | The trough | Value in 2018, best condition |
|---|---|---|---|
| Jaguar XJ220, 1991 to 1993 | 600,000 USD | about 110,000, down 81.7 % | still under list |
| Ferrari F40, 1987 to 1992 | just under 400,000 | under half of list | 1,350,000 USD |
| BMW M1, 1978 to 1981 | 115,000 USD | under half of list | 655,000 USD |
| McLaren F1, 1994 to 1998 | 815,000 USD | down 16.67 % | about 10 times list |
| Ferrari 288 GTO, 1984 to 1985 | 85,000 USD | never below list | 2,700,000 USD |
The floor is not at a standard depth
Read the trough column on its own. The XJ220 lost 81.7 per cent, from 600,000 to about 110,000. The McLaren F1 lost 16.67 per cent, which on 815,000 is about 679,100. Both are limited production supercars from the same decade, both are now historically significant, and their worst days were 65 percentage points apart.
The rebounds are further apart still. Measured against original list:
- Ferrari 288 GTO: 2,700,000 against 85,000, about 31.8 times list.
- McLaren F1: about 10 times its 815,000 list, so roughly 8,150,000.
- BMW M1: 655,000 against 115,000, about 5.7 times list, with the significant rise arriving between 2010 and 2015, three decades after production.
- Ferrari F40: 1,350,000 against just under 400,000, about 3.4 times list, and roughly 6.8 times its trough of under half list.
- Jaguar XJ220: below its 600,000 list, more than 25 years after the last one was built.
Four recoveries and one that has not happened. The XJ220 is the case that gets left out of the encouraging version, and it is the one an owner should read first, because nothing about it looked different at purchase. It was a limited run flagship from a famous marque with a headline top speed.
When the floor arrives
The study gives dates rather than a formula, and the dates cluster loosely. The XJ220's documented low sales came in the early 2000s, roughly a decade after build. The F40 could be bought for less than half of list in the late 1990s and early 2000s, again around a decade on. The M1's recovery took until 2010 to 2015, some thirty years after the last car.
The practical reading is that the trough tends to sit around a decade out, and the recovery, where it happens at all, is measured in decades rather than years. Anyone treating a five year old car as a car that has finished falling is applying the second half of a pattern to the first half of a timeline.
The cars that skipped the trough
The same study found eight models built in 2002 or later that had never been sold below their original list price, with these twelve month value changes at the time:
| Model | List when new | Twelve month change |
|---|---|---|
| Pagani Huayra, 2012 to 2019 | 1,400,000 USD | +21.64 % |
| Ferrari 599 GTO, 2011 | 450,000 USD | +18.29 % |
| Porsche 911 R, 2016 | 185,000 USD | +15.00 % |
| Ferrari 599 SA Aperta, 2011 | 500,000 USD | +14.46 % |
| McLaren P1, 2014 to 2015 | 1,350,000 USD | +12.43 % |
| Ferrari Enzo, 2002 to 2004 | 650,000 USD | +12.42 % |
| Ferrari LaFerrari, 2014 to 2015 | 1,400,000 USD | +4.71 % |
| Porsche 918 Spyder, 2014 to 2015 | 847,000 USD | -10.47 % |
Even inside a list of cars defined by never falling below list, the twelve month spread runs from +21.64 to -10.47 per cent, a range of 32.11 percentage points. The 918 Spyder was losing value at the time and was still above the price it was sold at, which is the distinction most reporting on this subject collapses.
Hagerty's own explanation for the group is supply: build numbers are very low, buying one depends on standing with the maker, and ownership often comes with an expectation that the car is kept. That is the same mechanism that decides the first three years, running over a longer horizon.
What this cannot tell you
The named values are from January 2018 and are not current. The pattern is what carries: a trough roughly a decade out, recoveries that take decades and are not guaranteed, and a small group of very short run cars that never dip at all. A current model cannot be placed in either group yet, because the thing that decides it, whether demand outlives the production run, has not been tested.
Questions readers ask
At what age does a supercar stop losing value?
On the Hagerty evidence the trough tends to arrive around a decade after build. The Jaguar XJ220's documented low sales came in the early 2000s on a car built from 1991 to 1993, and the Ferrari F40 was available under half of list in the late 1990s and early 2000s.
Does every supercar recover its value eventually?
No. The XJ220 fell about 81.7 per cent, from 600,000 to around 110,000 USD, and had still not returned to its original list price at the time of the study, more than 25 years after production ended.
Which car in the study did best?
The Ferrari 288 GTO, which never fell below its 85,000 USD list price and was valued at 2,700,000 USD in best condition in 2018, about 31.8 times list. The McLaren F1 recovered to roughly 10 times its 815,000 USD list after a fall of only 16.67 per cent.
How long does a recovery take?
Decades where it happens. The BMW M1 was available at under half its 115,000 USD list before rising significantly between 2010 and 2015, roughly thirty years after the last car was built, reaching 655,000 USD in best condition.
Are modern supercars different?
Some are. Eight models built in 2002 or later had never sold below list at the time of the study, including the Ferrari Enzo, McLaren P1 and Pagani Huayra. Hagerty attributes that to very low build numbers, allocation through the maker and an expectation that owners keep the car.
Can I use these values today?
Not as prices. They date from January 2018. The structure they show, a deep trough around a decade out and a slow uncertain recovery, is the part that transfers.
Sources
- Hagerty, are today's supercars immune to depreciation, published 26 January 2018, for the 28 car comparison, the named list prices and troughs, the 2018 condition values and the eight models never sold below list.
- Hagerty UK, modern supercar depreciation, published 19 May 2021, for the first three years of the same curve, at about 6 per cent and 20 per cent.