Depreciation
Which Options Pay Back at Resale, and Which Never Do
Yellow cars lost 24.0 per cent over three years against a 31.0 per cent average across 1.2 million cars. Colour is measurable. Most options are not, and the reason is the same one.
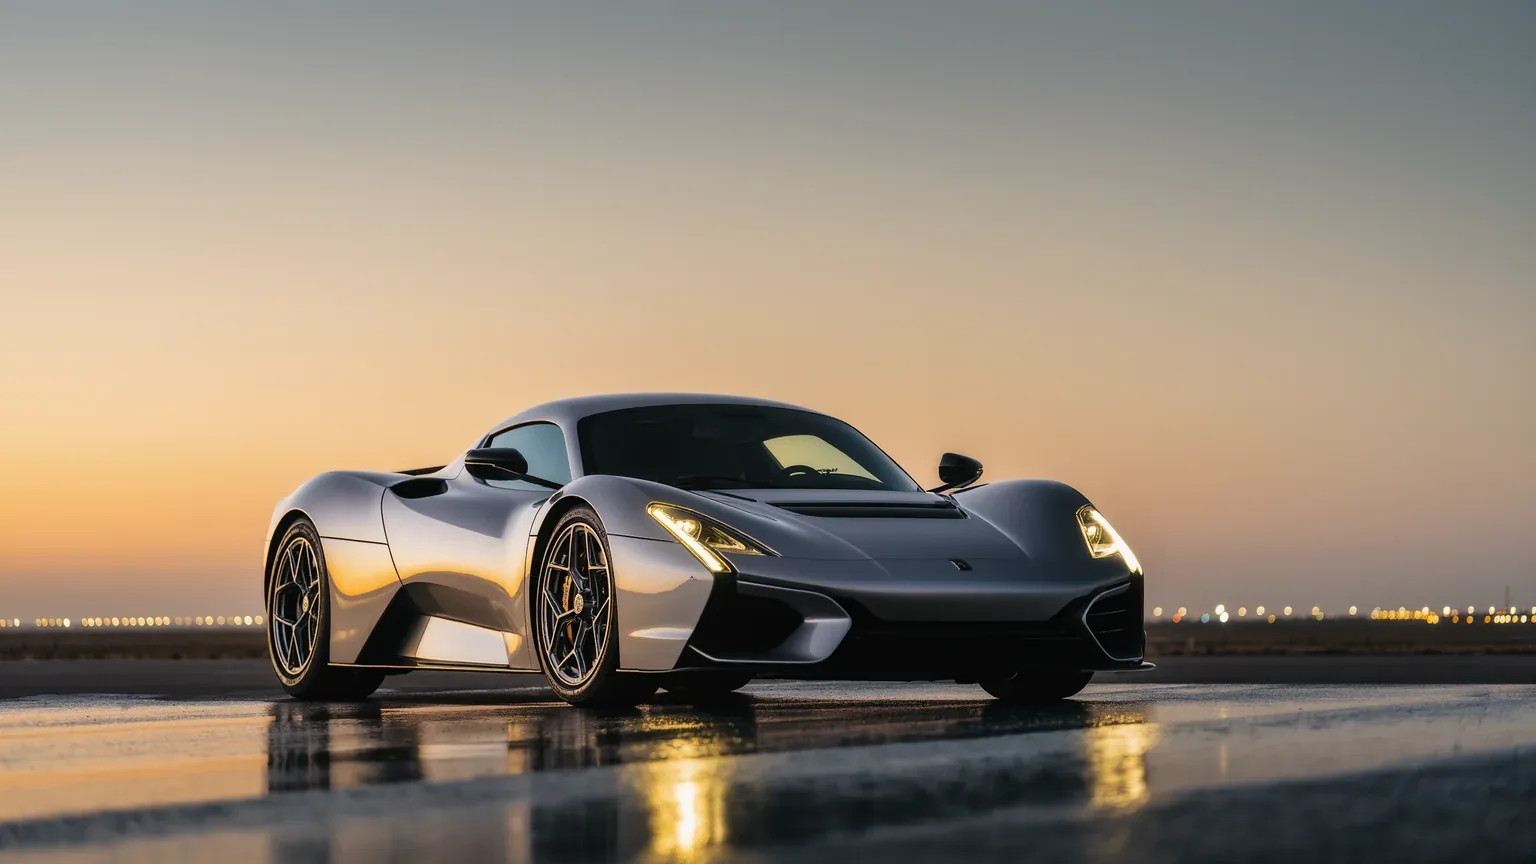
iSeeCars compared 1.2 million three year old cars and found yellow ones down 24.0 per cent against a market average of 31.0 per cent. That is a real, measured, seven point gap decided by a paint code. The same mechanism governs which options come back and which do not, and it is not the one most order sheets are filled in with.
The colour data, in full
The study covered 1.2 million model year 2022 used cars sold between August 2024 and May 2025, each three years old at the point of sale. Average depreciation across the whole set was 31.0 per cent, or 14,360 USD.
| Colour | Loss | Loss in USD | Against average |
|---|---|---|---|
| Yellow | 24.0 % | 13,667 | 7.0 points better |
| Orange | 24.4 % | 9,951 | 6.6 points better |
| Green | 26.3 % | 13,152 | 4.7 points better |
| Market average | 31.0 % | 14,360 | reference |
| Black | 31.9 % | 15,381 | 0.9 points worse |
| White | 32.1 % | 15,557 | 1.1 points worse |
| Gold | 34.4 % | 16,679 | 3.4 points worse |
The study's own explanation is a supply one. Yellow and orange are not widely popular colours, they have more demand than supply, and that combination lifts the used price. Black and white are ordered by default, so a black car competes against every other black car on the market.
Where the percentage and the money disagree
Orange is the line to read twice. It lost 24.4 per cent and only 9,951 USD, while yellow lost 24.0 per cent and 13,667 USD. A smaller percentage cost more money.
The reason is the base. Dividing loss by rate gives the implied average new price of each group: about 56,946 USD for the yellow cars, about 40,783 USD for the orange ones and about 46,323 USD across the market. Orange sits on cheaper cars. The percentage compares rates of loss, the dollar column compares populations, and quoting one while meaning the other is the most common error in this whole subject.
Why the same rule governs options
A colour that is rare and wanted carries a premium. An option that is common, or rare and unwanted, does not. That is the entire test, and it explains an order sheet better than any list of recommended boxes.
- Options are charged in full and returned in part. On this class of car they routinely add 15 to 25 per cent to the transaction price, while published residual percentages are quoted against list price before options. The specification is priced in on the way in and largely averaged out on the way back.
- Structural and mechanical choices survive better than decorative ones. A different brake material, a lifting axle or a roof configuration changes what the car is and what a later buyer can search for. A contrast stitch colour does not.
- A specification that narrows the buyer pool costs money twice. It cost list price at order, and it removes bidders at sale. A car nobody else would have specified is a car fewer people will buy.
- The premium over list disappears before depreciation starts. Anything paid above list on an allocated car is normally the first value to go.
A worked order sheet
Take a car at 250,000 list. Specification A adds 18,000 in structural options. Specification B adds 45,000, mostly in trim, personalisation and a bespoke paint. Both cars resell three years later at 80 per cent of list, which is 200,000, because the market prices the model rather than the order sheet.
| Item | Specification A | Specification B |
|---|---|---|
| List price | 250,000 | 250,000 |
| Options | 18,000 | 45,000 |
| Paid | 268,000 | 295,000 |
| Resale at 80 per cent of list | 200,000 | 200,000 |
| Money lost | 68,000 | 95,000 |
| Loss against what was paid | 25.4 % | 32.2 % |
The 27,000 difference in specification produced a 27,000 difference in loss and no difference in sale price. Both cars are correctly described as being at 80 per cent of list. Their owners lost 6.8 percentage points apart.
This is the honest case rather than the worst one. A genuinely wanted specification does move the sale price, and a bespoke paint on a short run car is exactly the rare and wanted combination the colour study rewards. The point is that it has to be rare and wanted, and that most of an expensive order sheet is neither.
Questions readers ask
What car colour holds its value best?
Yellow, at 24.0 per cent depreciation over three years against a 31.0 per cent average, across 1.2 million cars. Orange follows at 24.4 per cent and green at 26.3 per cent. Gold was worst at 34.4 per cent.
Why do yellow and orange cars hold value?
Because they are unpopular to order and therefore rare to find, while still having a set of buyers who specifically want one. Demand above supply lifts the used price. Black and white are the default choices, so those cars compete against a very large field.
Orange lost a smaller percentage but more money. How?
The two columns measure different things. Orange lost 24.4 per cent and 9,951 USD, yellow 24.0 per cent and 13,667 USD, because orange sits on cheaper cars. Dividing loss by rate implies an average new price of about 40,783 USD for orange against about 56,946 USD for yellow.
Do options increase resale value?
Rarely in proportion to their cost. Options add roughly 15 to 25 per cent to the transaction price on this class of car, while published residual figures are quoted against list price before options. Structural choices hold better than decorative ones, and a specification nobody else wanted narrows the field of buyers.
Is a bespoke paint a waste of money at resale?
Not necessarily, and it is the one option that has measured support behind it. The colour study rewards rare colours that people want. The failure case is a colour that is rare because it is unwanted, which costs the full option price at order and removes bidders at sale.
Does this colour study cover supercars?
No. It is a mainstream sample of 1.2 million three year old cars from model year 2022, sold between August 2024 and May 2025. The mechanism it measures, rarity against demand, is the same one that drives supercar residuals, but the percentages should not be applied to a supercar directly.
Sources
- iSeeCars, the best and worst car colours for resale value, for the 1.2 million car sample, the three year rates by colour and the dollar losses.
- Hagerty UK, modern supercar depreciation, published 19 May 2021, for the supercar three year averages the option arithmetic is set against.